
MY22–MY25 · Standard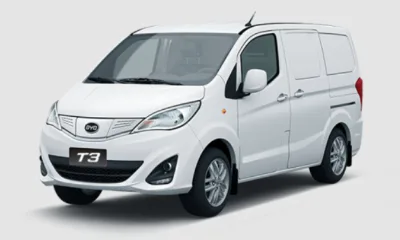
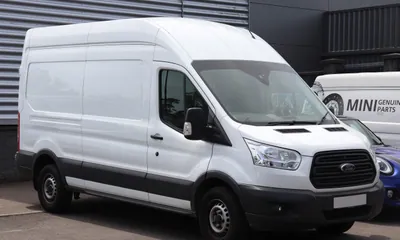
The BYD T3 is rated 300 km on the WLTP cycle, the Ford E-Transit 295. A 10–80% stop takes 45 minutes in the BYD T3 and 34 in the Ford E-Transit. Every figure below names the badge it belongs to, and the three tools further down turn the same numbers into a charging race, a road trip and a yearly bill.
At a glance
BYD T3 · Standard
300km WLTP
45min 10–80%
A$39,990from
Ford E-Transit · 420L
295km WLTP
34min 10–80%
A$89,990from
The short answer
The BYD T3 is rated 300 km against 295 — 5 km, 2% further. It uses 20 kWh to cover 100 km where the Ford E-Transit needs 23.
A 10–80% stop takes 34 minutes in the Ford E-Transit and 45 in the BYD T3. On a 50 kW post it is 42 and 57 minutes, so most of the advantage disappears at a slow site.
The Ford E-Transit lists 12,400 L of luggage space against 3,800 L.
Which one, in one line
Pick the Ford E-Transit ifit wins on charging (34 minutes against 45), space (12,400 L of boot against 3,800 L).
The priceThe BYD T3 is the cheaper to buy, listed from A$39,990; both are list prices before on-road costs and incentives.
Charging, raced
Charging speed is a station number and a car number, and the smaller one wins. Set the post and both cars fill against the same clock — the interesting part is not who wins, it is how much of the gap a slow post takes away.
Each car is modelled on its own published 10–80% time, which gives an average power over that window: 47 kW for the BYD T3, 84 kW for the Ford E-Transit. A post above that average changes nothing; a post below it sets the pace.
At 150 kW, going from 10% to 80% takes 45 min in the BYD T3 and 34 min in the Ford E-Transit — a gap of 11 minutes. Both cars are limited by their own packs at this post, so a bigger station would change nothing.
Every figure
A tick marks a figure that is simply more useful — more range, less energy per 100 km, a faster stop. Rows without a tick are different, not better: a bigger battery, a taller body and a heavier car are all trades, and this page does not pretend otherwise.
| Measure | BYD T3 | Ford E-Transit |
|---|---|---|
| Range and efficiency | ||
| WLTP range | 300 km✓MY22–MY25 Standard | 295 kmMY25–MY26 420L |
| Efficiency | 5 km/kWh✓ | 4.35 km/kWh |
| Energy per 100 km | 20 kWh✓ | 23 kWh |
| Battery | 50.3 kWh | 68 kWh |
| Charging | ||
| DC peak | 60 kW | 115 kW✓ |
| 10–80% at peak | 45 min | 34 min✓ |
| Average power, 10–80%(derived) | 47 kW | 84 kW✓ |
| AC maximum | 7 kW | 11 kW✓ |
| Fast-charge plug | CCS2 | CCS2 |
| AC plug | Type 2 | Type 2 |
| Size and weight | ||
| Length | 4,460 mm | 5,981 mm |
| Width | 1,720 mm | 2,059 mm |
| Height | 1,875 mm | 2,549 mm |
| Kerb weight | 1,720 kg | 2,565 kg |
| Space and practicality | ||
| Seats | 2 | 3✓ |
| Boot | 3,800 L | 12,400 L✓ |
| Performance and warranty | ||
| Power | 70 kW | 198 kW✓ |
| 0–100 km/h | 12.0 s | 10.0 s✓ |
| Drive | FWD | RWD |
| Battery warranty | 5yr 150,000km / 8yr 160,000km | 5yr unlimited km / 8yr unlimited km |
| Price | ||
| Starts at | A$39,990✓list, before on-road | A$89,990list, before on-road |
| Dearest version | A$39,990✓ | A$89,990 |
| Per km of WLTP range | A$133.30/km✓cheapest version | A$305.05/kmcheapest version |
| Drive-away | A$41,600–A$43,200where the feed lists it | A$94,500–A$98,500where the feed lists it |
How to read the mixed rows. Range, efficiency, battery and charging come from one badge — the longest-range version of each car's current model year, not the longest range it has ever been rated at. The catalogue stores one record per badge, so where two figures come from different badges the row names the one it used.
What WLTP is not. It is a laboratory cycle at a fixed temperature, with the air conditioning off and a gentle acceleration profile. It exists so two cars can be compared on the same test, not so a driver can predict a highway run. Expect less on a 110 km/h trip, and less again in winter.
What this page does not claim. No ANCAP crash rating: the catalogue carries none, and a column of dashes would read like a failure rather than a gap. Prices are manufacturer list before on-road costs; the drive-away band appears only where the feed publishes one.
Your numbers
Two questions decide most purchases: how often you stop, and what the year costs. Both are arithmetic on the figures above, so change the inputs and the answer changes with you.
Starts full, arrives at 10%, charges back to 80% at each stop, and assumes a highway range of 85% of the WLTP figure.
stops · 225 min charging
stops · 170 min charging
Energy at the wheels from the WLTP label, priced at the tariff you pay. Home charging is usually cheaper than the directory's median.
A$10 per 100 km
A$12 per 100 km
The trip model ignores charger detours, queueing and the last 10% of the pack, which is slow on both cars. The yearly cost is energy only: no session fees, no idle fees, no home-charger installation, and no petrol car to compare against.
Your priorities
There is no single winner, only a winner for a set of priorities. Move the sliders and the weighting changes — nothing here is a magazine score, and the page never hides the numbers it is built from.
Weighted result
wins 3 of 6 measures on these weights
Each measure is scaled between the two cars, so a weight of 5 means “this is the thing I care about” and 0 means “I do not care at all”. The scores are relative, not a rating out of ten.
Questions
Every figure here comes from the same data as the rest of the page. Where the data cannot answer, the page says so instead of guessing.
Still unsure about a term? The connector guide covers the plugs, and the vehicle guide the rest.
The BYD T3. The BYD T3 is rated 300 km and the Ford E-Transit 295, each on the longest-range badge of its current model year — MY22–MY25 Standard and MY25–MY26 420L respectively. WLTP is a laboratory cycle run at a fixed temperature with the air conditioning off, so treat the figure as a way to compare one car with another rather than a prediction for a highway run in summer.
The Ford E-Transit. Going from 10% to 80% takes 45 minutes in the BYD T3 (60 kW peak) and 34 in the Ford E-Transit (115 kW peak). At a slow post the station becomes the limit and the gap narrows, because the slower car is short of power rather than short of time.
Yes. Both list CCS2 for DC fast charging, so either car can use the same sites without an adapter. An adapter still cannot raise the power a car will accept.
The BYD T3, by about A$225.00 a year at 15,000 km and A$0.50 per kWh. It uses 20 kWh per 100 km against 23. That is energy only, at the wheels: session fees, idle fees and home-charger installation are not in it.
The Ford E-Transit: 3,800 L of luggage space against 12,400 L, and 3 seats against 2. Makers measure boot volume by different conventions — some to the window line, some under the parcel shelf — so read the direction as reliable and the size of the gap as indicative.
The BYD T3 is the cheaper of the two, listed from A$39,990 against A$89,990 for the Ford E-Transit — A$50,000 between the two starting prices. Both are manufacturer list prices before on-road costs, options and any incentive, so a dealer's drive-away number will differ.
Every figure on this page comes from the same records the BYD T3 and Ford E-Transit pages use. How the sources are chosen, and what a figure here never claims, is on the methodology page.